Understanding the Spoon Theory
Living with a chronic illness like multiple sclerosis (MS) isn’t easy — especially when others lack understanding for you. Explaining your experiences to others is just as tough — so tough that one chronic illness sufferer came up with a metaphor to help others understand.
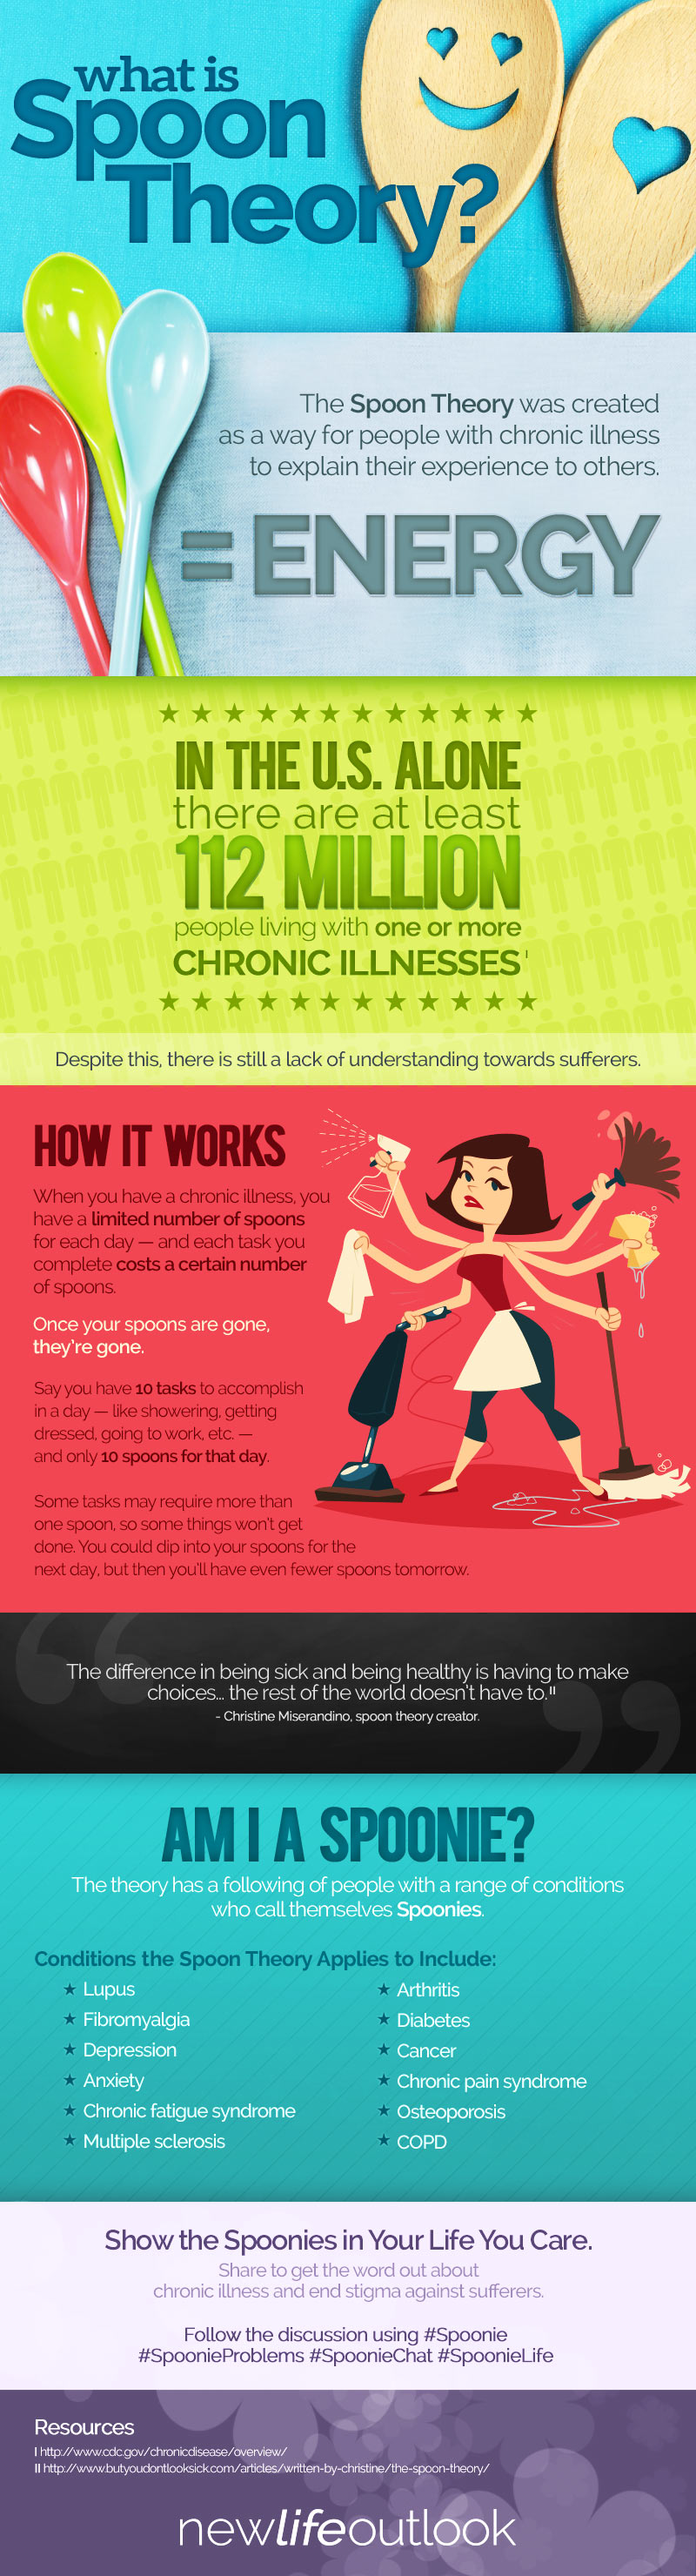
Lupus sufferer Christine Miserandino came up with the spoon theory to help explain what she was going through to her best friend. Using spoons to represent energy, she explained that each task completed in a day “costs” a certain amount of spoons.
Where healthy people have a high or unlimited amount of spoons, chronic illness sufferers have a set number in a day — once they’re gone, they’re gone. This is how chronic illness sufferers have come to explain their day-to-day experiences to others.
Spoon theory followers refer to themselves as “Spoonies,” and connect with each other and share experiences through social media. Read on to learn more and join the conversation!
You May Also Like:Learning to Live Life in a Wheelchair With MS
Related Search Topics (Ads):